U.S. Corporate Tax Rate
Personal Project Fall 2015
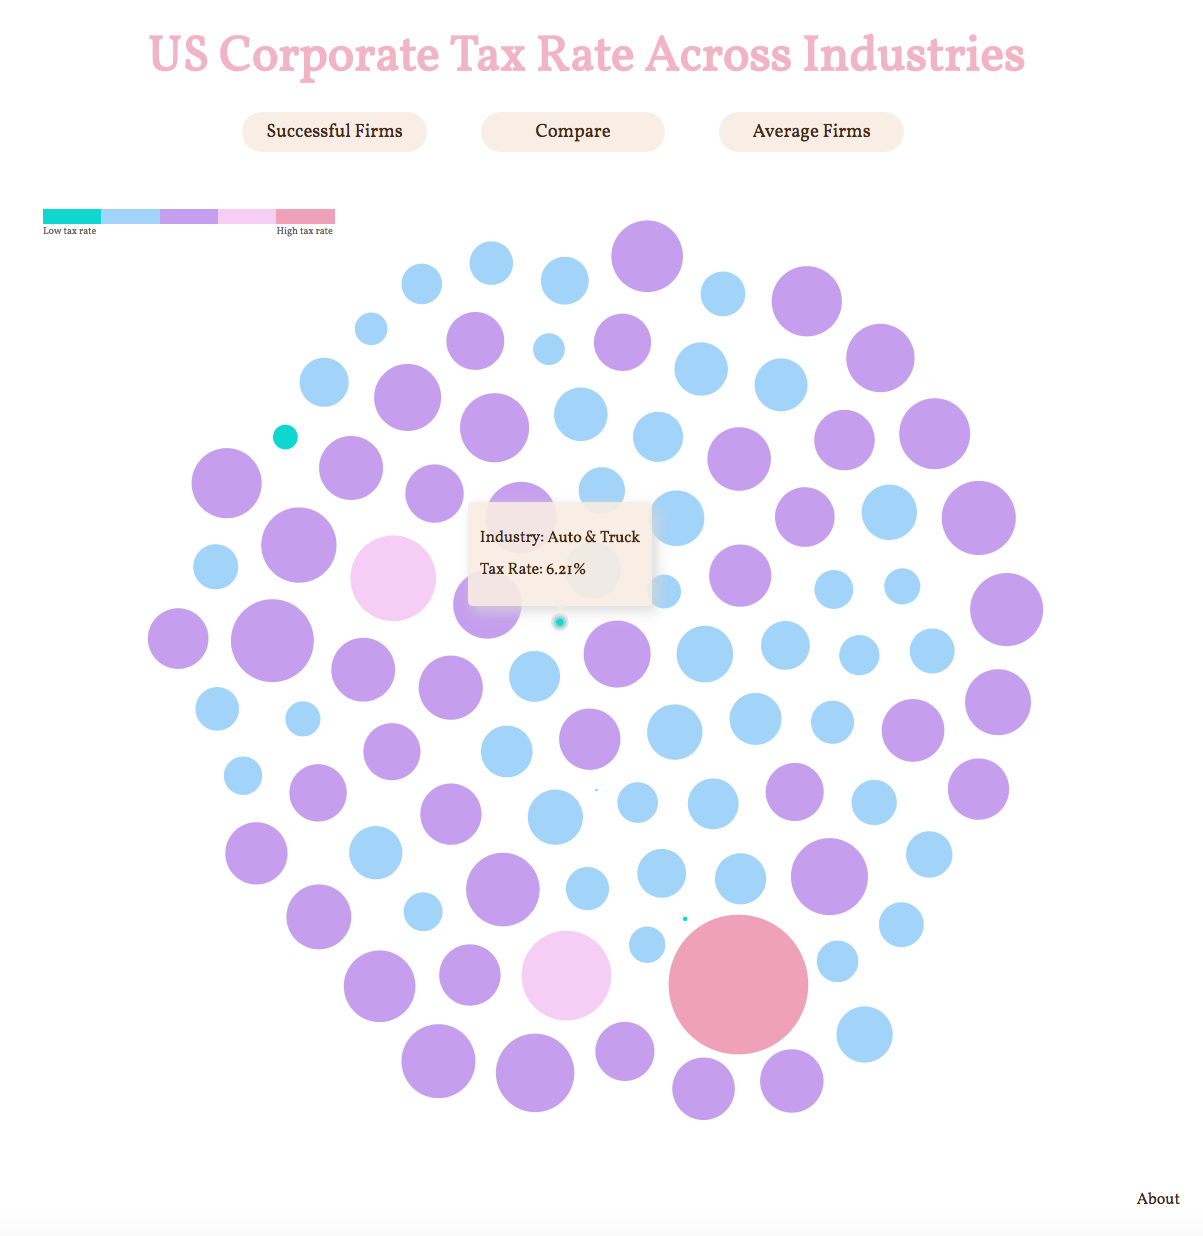
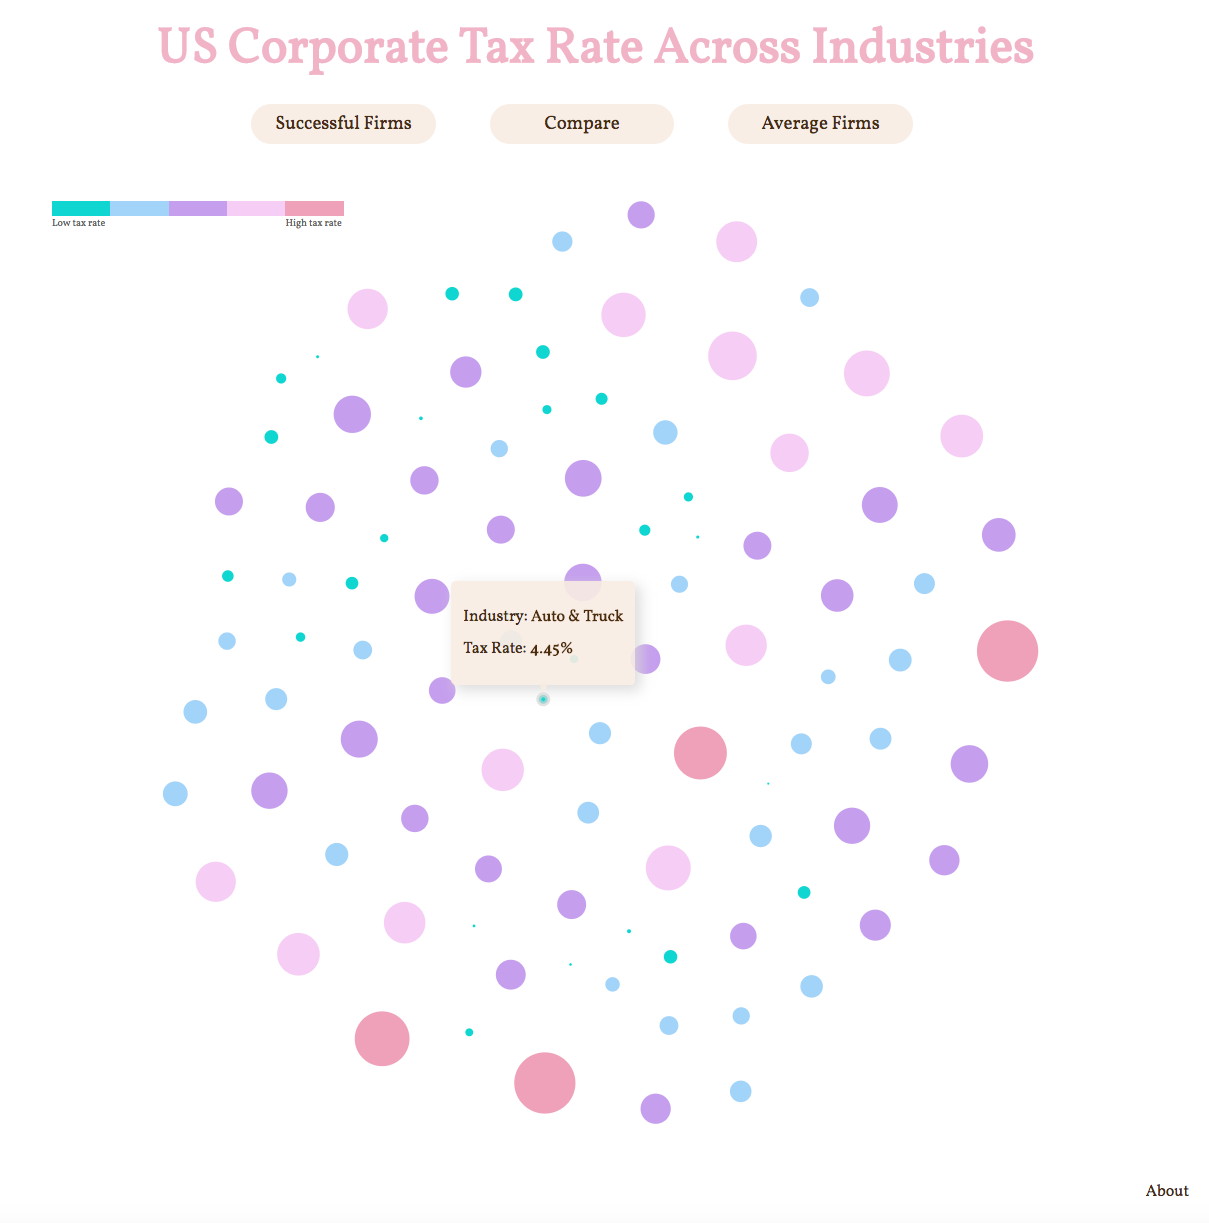
The web application displays U.S. corporate tax rate across different industries in bubble form. When users hover over the bubble, more specific data will be displayed. When clicked, the bubbles will lead user to an external website about the chosen industry and its tax information. The application both displays the average corporate tax rate and the successful corporation's tax rate. The contrasts are also illustrated by the overlaying bubbles. It is intriguing to observe the differences across different industries.
This project utilizes d3.js library and jQeury, and displays data from a static csv file downloaded from NYU Stern. It is created during a web development class. Code can be found on my github.
Details
The image on the left and the image above are screenshots of corporate tax rate of average firms and successful firms respectively. The color scale is discrete, with lower tax rate more cyan and higher rate more magenta.
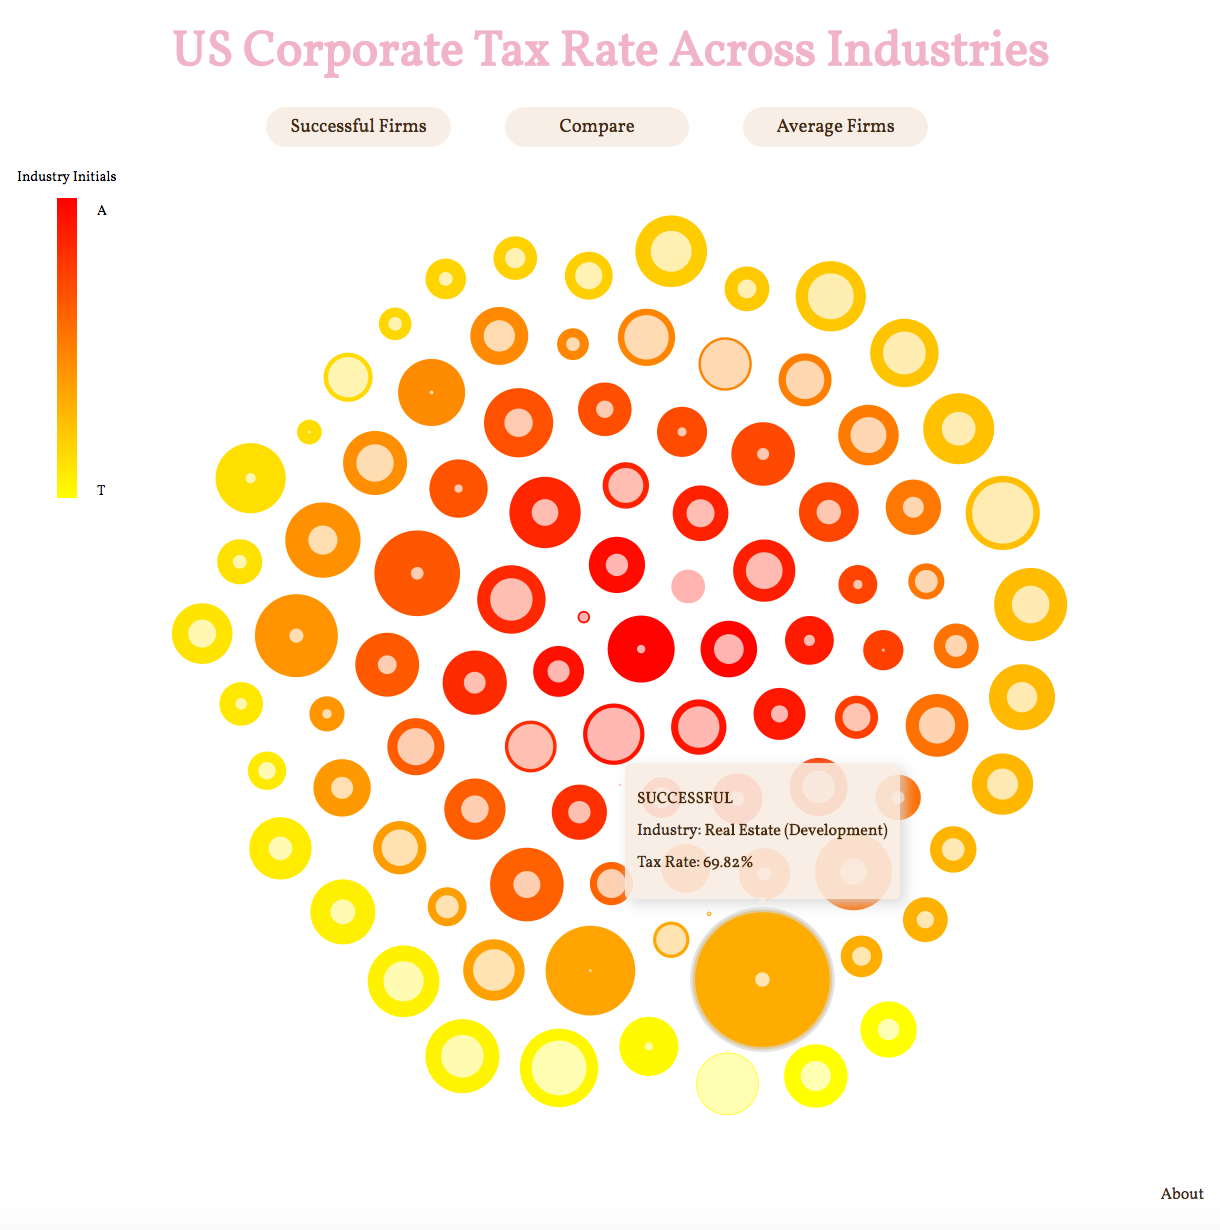
The image on the right is a screenshot of corporate tax rate comparison between both average firms and successful firms. The color scale is continuous, alphabetically ordered by the initials of the industry name.